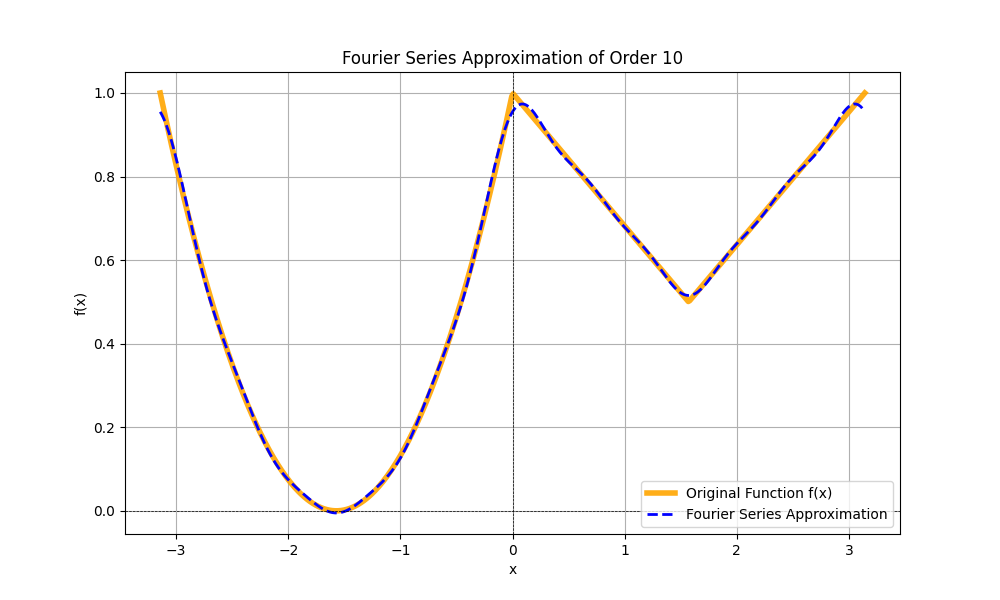
import numpy as np
import matplotlib.pyplot as plt
from scipy.integrate import quad


# Define the piecewisely defined C1-function
def f(x):
    if x < 0:
        return (4 / np.pi**2) * (x + np.pi / 2) ** 2
    elif 0 <= x < np.pi / 2:
        return 1 - (1 / np.pi) * x
    else:
        return (1 / np.pi) * x


# Define the period from -pi to pi
pi = np.pi


# Calculate a_0, a_n, b_n coefficients
def a_0tilde():
    return (
        (1 / np.sqrt(2)) * (1 / pi) * quad(f, -pi, pi)[0]
    )  # Integrate over the full period


def a_n(n):
    return (1 / pi) * quad(lambda x: f(x) * np.cos(n * x), -pi, pi)[0]


def b_n(n):
    return (1 / pi) * quad(lambda x: f(x) * np.sin(n * x), -pi, pi)[0]


# Number of terms in the Fourier series
N = 10  # Adjust this value for more or less accuracy


# Construct the Fourier series
def fourier_series(x):
    series_sum = (1 / np.sqrt(2)) * a_0tilde()
    for n in range(1, N + 1):
        series_sum += a_n(n) * np.cos(n * x)
        series_sum += b_n(n) * np.sin(n * x)
    return series_sum


# Create a range of x values for plotting
x_values = np.linspace(-pi, pi, 500)
y_values_f = [f(x) for x in x_values]  # Original function values
y_values_fs = [fourier_series(x) for x in x_values]  # Fourier series values

# Plot the original function and its Fourier series
plt.figure(figsize=(10, 6))
plt.plot(
    x_values,
    y_values_f,
    label="Original Function f(x)",
    color="orange",
    linewidth=4,
    alpha=0.9,
)
plt.plot(
    x_values,
    y_values_fs,
    label="Fourier Series Approximation",
    color="blue",
    linestyle="--",
    linewidth=2,
)
plt.title(f"Fourier Series Approximation of Order {N}")
plt.xlabel("x")
plt.ylabel("f(x)")
plt.axhline(0, color="black", lw=0.5, ls="--")  # Add a horizontal line at y=0
plt.axvline(0, color="black", lw=0.5, ls="--")  # Add a vertical line at x=0
plt.grid()
plt.legend()
plt.show()

